Sources on this page
Every number on this page comes from a named source. Click any source to open the document in a new tab.
If a link has moved or a document has changed, let us know and we will update the record and log the change.
Columbia, Richland County, SCDeveloper: DartPointsCensus GEOID 45079
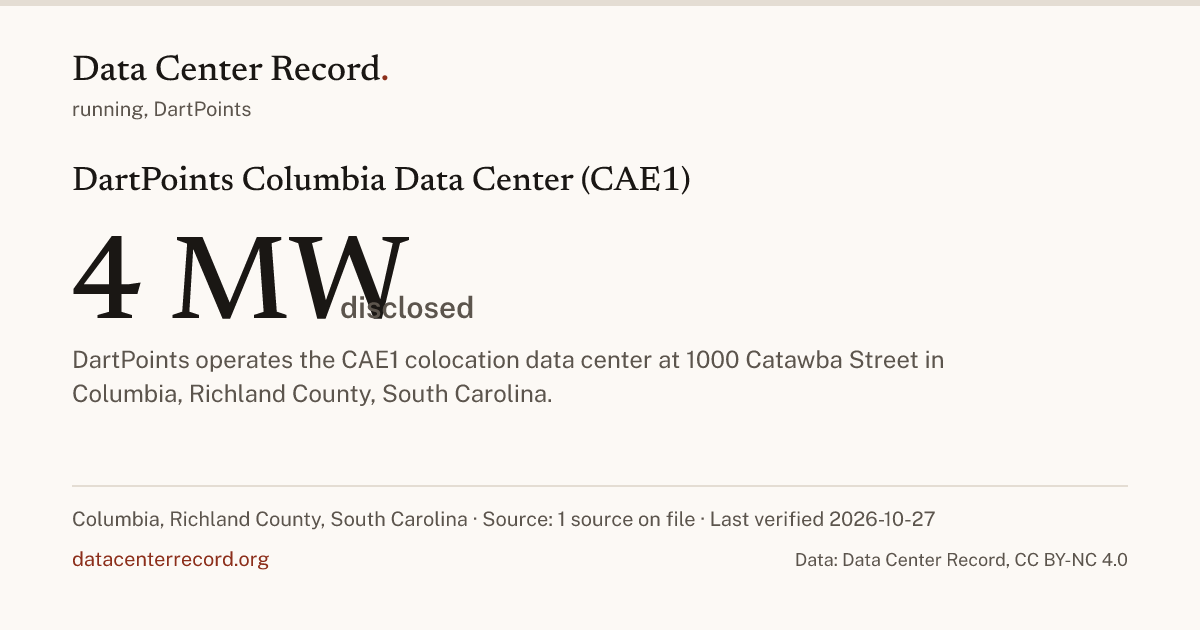
DartPoints operates the CAE1 colocation data center at 1000 Catawba Street in Columbia, Richland County, South Carolina. It is running; the record holds no sourced date for when it reached that stage.
How much water it would use and who would use it have not been disclosed.
Tap a pin for the data center, the parcel for its record
The other pins are the published projects in the same state, each in its stage color. The imagery beneath is the USGS national orthoimagery, public domain, shown so the land around the site can be read.
How to read this page. Every fact links to the source it rests on; a number in brackets is its place in the source list. A figure no source gives reads Not disclosed, and nothing is estimated. Where sources give different figures, each is shown with who gave it, and another source's figure never stands in for the record's own. Entries are added and never overwritten; corrections are listed under What happened.
Each figure as its source gave it. The number in brackets is its place in the source list.
Sources:
A comparison is arithmetic on two published rows and is never a new fact (how comparisons are made).
| Field | Value | Who says so | Source | Last verified |
|---|---|---|---|---|
| How much power it needs | 4 MW | the developer's figure | [1] dartpoints.com (opens in a new tab) | October 27, 2026 |
| How much water it would use | ||||
| How loud it would be | ||||
| Jobs once it runs | ||||
| Tax it would pay each year |
| Field | Value | Who says so | Source | Last verified |
|---|---|---|---|---|
| Who is building it | DartPoints | as stated by the source | October 27, 2026 | |
| Who is constructing it | ||||
| How much land | ||||
| Buildings | 1 building | operator page, verified October 27, 2026 | [1] dartpoints.com (opens in a new tab) | October 27, 2026 |
| Where its power comes from | ||||
| Grid connection | ||||
| How it is cooled |
A blank value cell means not disclosed by any source on file; a blank basis cell means the source gave the figure without saying on what basis.
The developer's figure is what the company said; what a permit allows is the ceiling a permit sets; measured means observed. Water is in gallons a day or a year, whichever the source stated; a tax claim given as a range shows both ends, each linked to the source that gave it.
The record adds each the day a source gives it. Why these documents.
No dated entry is on the record yet.
Read on October 27, 2026 (the day the page was read; it gives no date of its own)
Verified facility status from South Carolina DES permits, SC Public Service Commission dockets, county council ordinances, or operator campus specifications.
The pin is the site's address.
The record has 2 measures of its size: 4 MW (the developer's figure, dartpoints.com (opens in a new tab)) and 1 building (operator page, verified October 27, 2026, dartpoints.com (opens in a new tab)). Its acreage is not disclosed.
DartPoints is the developer. No construction contractor is named on the record yet.
Power: 4 MW (the developer's figure, dartpoints.com (opens in a new tab)). Water: not disclosed by any source on file.
It is running; the date it reached that stage is not sourced, only the day a page was read. No dated entry is on the record yet.
No decision by Columbia or Richland County about data centers is on the record. The Richland County page and the South Carolina scorecard list every rated row the day a person publishes one.
1 source on file.
This site is in the SERC Virginia and Carolina South (SRVC-S) regional power market. 2024 to 2025 wholesale price effect: 7.5 percent (+$3.01 per MWh, 2024 to 2025), modeled wholesale price effect, Dallas Fed WP 2606r1, third party estimate. 2028 projected wholesale price effect: 14.7 percent (+$4.94 per MWh, 2028 projected), modeled wholesale price effect, Dallas Fed WP 2606r1, third party estimate.
Every number on this page comes from a named source. Click any source to open the document in a new tab.
If a link has moved or a document has changed, let us know and we will update the record and log the change.
These studies measure different things. Some model wholesale market prices. Some measure what households actually paid. Some model what would happen under a policy change. The record shows each one as the authors stated it and does not rank them.
These studies measure different things. Some model wholesale market prices. Some measure what households actually paid. Some model what would happen under a policy change. The record shows each one as the authors stated it and does not rank them.
| Study | What it measured | Finding | Years covered | Method | Who funded or published it |
|---|---|---|---|---|---|
| Plante, Carrasco, Miranda Pineda and Patel, Federal Reserve Bank of Dallas Working Paper 2606r1 (opens in a new tab) | Wholesale electricity price effect and retail electricity rate pass through | Data center demand accounts for an average 6.5 percent increase in wholesale electricity prices across 23 regional markets in 2024 and 2025, reaching 15.0 percent (+$5.22 per MWh) in SERC Virginia and Carolina North and 15.4 percent (+$5.68 per MWh) in the Northwest Power Pool, with wholesale changes passing into retail prices roughly in proportion to the wholesale share of the retail bill over 12 to 24 months. | 2019 to 2025 historical and 2026 to 2028 scenario projections | Synthetic supply stack model across 23 regional power markets combined with reduced form retail pass through regressions | Federal Reserve Bank of Dallas (government research working paper; views are the authors') |
| Watten, Bistline and Blanford, Electric Power Research Institute (arXiv:2606.19777) (opens in a new tab) | State level retail electricity rate change across all customer classes | Where data centers pay standard industrial rates and improve grid utilization, state average retail rates could fall by roughly 1 percent nationally by 2030 (up to 4 percent in high growth states, or roughly $7 billion per year in fixed cost spreading); outcomes reverse toward higher residential bills if new generation and transmission upgrades outpace load revenues. | 2026 to 2030 | Capacity expansion and utility revenue requirement model allocating fixed transmission and distribution costs across customer classes | Electric Power Research Institute (nonprofit energy research institute funded primarily by member electric utilities) |
| Meeks, Pless, Qi and Wang, MIT Center for Energy and Environmental Policy Research (opens in a new tab) | Realized utility revenue and customer bill changes from historical data center openings | In the 6 years following data center entry (1998 to 2018), average electric utility revenue rose 8 percent (+$104 million per utility per year), residential bills rose 2 percent (+$30 per household per year) and commercial bills rose 4 percent (+$262 per customer per year), driven by peak coincident demand charges and infrastructure capital additions. | 1998 to 2018 | Difference in differences event study of historical data center openings matched to utility level EIA Form 861 billing and revenue panels | MIT Center for Energy and Environmental Policy Research (university working paper) |
| Norris, Profeta, Patino Echeverri and Cowie, Duke University Nicholas Institute (NI R 26-04) (opens in a new tab) | Grid headroom and new gigawatts of large load accommodated under minimal peak hour curtailment | Across 22 major US balancing authorities, roughly 76 GW of new data center load can be integrated without building new peaking capacity if facilities curtail load by 0.25 percent of annual operating hours (roughly 22 hours per year), expanding to 98 GW at 0.5 percent annual curtailment and 126 GW at 1.0 percent annual curtailment. | 2025 to 2035 | Hourly balancing authority load duration and reserve margin modeling across 22 US power systems | Duke University Nicholas Institute for Energy, Environment & Sustainability (university research institute) |
| Jeremiah Johnson et al., North Carolina State University (Environmental Research Letters) (opens in a new tab) | Wholesale electricity prices, residential bills by state and power sector carbon emissions through 2030 | Projected data center and crypto load growth raises US electricity demand 6 to 12 percent by 2030 and increases residential electricity bills up to 57 percent in the most heavily affected states (including Virginia at roughly $32 per month or $384 per year for an average household) while adding 49 to 125 million metric tons of CO2 per year. | 2024 to 2030 | National capacity expansion and unit commitment dispatch model (TEMOA) across US grid regions | North Carolina State University researchers in Environmental Research Letters (peer reviewed journal) |
| Monitoring Analytics, PJM Independent Market Monitor (Q1 2026 State of the Market Report) (opens in a new tab) | PJM Base Residual Auction capacity market clearing prices and total wholesale capacity bill attributable to data center load | Data center load growth was the primary driver of the PJM 2025/2026 and 2026/2027 capacity market tightness, accounting for $9.3 billion of the $14.7 billion total PJM capacity cost in the 2025/2026 delivery year and driving a 76 percent surge in PJM wholesale power costs in Q1 2026. | 2025 to 2027 delivery years and Q1 2026 | Counterfactual PJM Base Residual Auction clearing runs removing forecast and existing data center peak load additions | Monitoring Analytics, LLC (independent market monitor for PJM Interconnection, mandated by FERC) |
| Union of Concerned Scientists, Billions of Dollars in Unreported Data Center Costs in PJM (opens in a new tab) | Local transmission network upgrade costs triggered by data center interconnections in PJM | In PJM alone, $4.36 billion in transmission upgrades across 150 supplemental transmission projects in 2024 were triggered by data center connections and socialized across regional utility ratepayers under PJM tariff rules. | 2022 to 2024 PJM transmission expansion filings | Project by project audit of PJM Regional Transmission Expansion Plan (RTEP) and utility Attachment M-3 supplemental project filings | Union of Concerned Scientists (nonprofit advocacy group study) |
| Energy and Environmental Economics (E3), Understanding the Drivers of Rising Electricity Rates and the Role of Data Centers (opens in a new tab) | Historical drivers of US retail electricity rate increases and utility rate design for large loads | Historical US retail electricity rate increases from 2020 to 2025 were driven primarily by distribution capital spending, wildfire mitigation, natural gas price spikes and inflation rather than data centers, and well designed large load tariffs can keep new data center additions net neutral or beneficial for existing ratepayers. | 2020 to 2025 historical and forward rate design case studies | Decomposition of historical utility revenue requirements and illustrative utility tariff cost of service modeling | Energy and Environmental Economics (E3), industry commissioned consulting report |
| Nicholas Z. Muller, National Bureau of Economic Research Working Paper 35100 (opens in a new tab) | Monetized air pollution and greenhouse gas health and climate damages per megawatt hour of data center electricity use | Marginal air pollution and greenhouse gas damages from fossil fuel generation serving US data centers average $49 to $94 per MWh ($0.049 to $0.094 per kWh), rivaling or exceeding the direct wholesale price of electricity in coal and gas heavy interconnects such as PJM, MISO and SERC. | 2022 to 2025 | Integrated assessment marginal emissions and air quality transport model (AP4T) coupled with EPA CEMS unit level generation data | National Bureau of Economic Research (university working paper by Nicholas Z. Muller, Carnegie Mellon University) |
Every record on this page carries its sources and the date it was last verified. When you cite it in a story, a study or a public filing, link to this page and give the date you accessed it.
Data Center Record. DartPoints Columbia Data Center (CAE1). Last verified October 27, 2026. https://datacenterrecord.org/projects/dartpoints-llc-dartpoints-columbia-sc-cae1-columbia-sc. Accessed October 30, 2026.
Every row on this page is available to download with its source, its basis and the date it was last verified.
Download this page's records (CSV) JSON
Licensed CC BY-NC 4.0. Say where it came from and do not sell it or use it to train a commercial model without a license.
Free to use and republish with attribution for reporting, research, teaching and public filings under CC BY-NC 4.0. Commercial, enterprise, financial or AI training use needs a commercial license.
Data Center Record takes no money from data center developers, operators, utilities or trade groups. That rule does not change for licensing.
Data Center Record is an independent project and takes no money from data center developers, operators, utilities or trade groups. Reader support keeps the record free to read, with no ads and no paywall.
Last verified , first recorded . Every correction is logged on the corrections page. Report a correction · Send a tip about DartPoints Columbia Data Center (CAE1)
Data Center Record, "DartPoints Columbia Data Center (CAE1)", https://datacenterrecord.org/projects/dartpoints-llc-dartpoints-columbia-sc-cae1-columbia-sc. Data: Data Center Record, datacenterrecord.org, CC BY-NC 4.0.
The structured rows are CC BY-NC 4.0. Link to this page; that is what turns a reuse into a citation. Commercial use needs a license. Prose stays under copyright.